Ionization Energy Summary of Findings
Overview
For Ionization Energy (IE) we looked for videos that emphasized a conceptual understanding of periodic trends in ionization energy. Specifically, explaining periodic trends in first ionization energies and successive ionization energies. We avoided videos that were focused on memorization of periodic table trends. We were not focused on videos that only described periodic table trends or tricks for memorizing the trends without providing conceptual explanations for those trends. Stronger conceptual videos were ones that grounded explanations of ionization energy in the attraction between valence electrons and the positively charged nucleus. The following search terms were used to identify videos for consideration:
- Periodic trends, Ionization energy
- Successive ionization energy
- Second ionization energy
- Third ionization energy
- Ionization energy
- Ionization energy, Coulomb’s law
- Why does ionization energy decrease going down a family?
- Why does ionization energy increase going across a period in the periodic table?
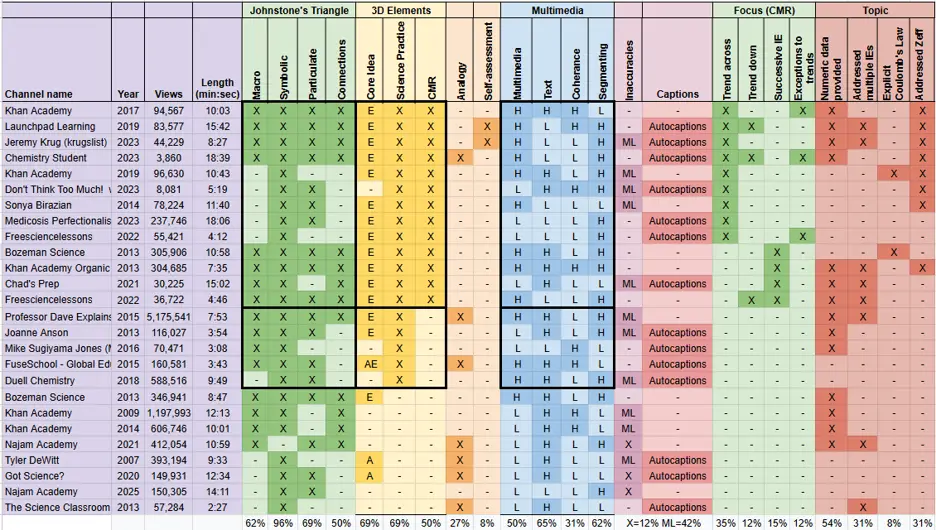
Our search yielded 71 videos that were in English, less than 15 minutes, and could potentially meet our concept of interest. Of these, we first examined the 28 videos with more than 100,000 views to focus on videos students would be most likely to encounter. Upon our initial review, many of these (15/28) were found to not meet our concept of interest. This resulted in us adding several other videos in the 20,000 – 90,000 view range to our list of videos to be analyzed as well as one with a notably lower view count from a known creator. This video was also slightly longer than the 15 min cut off at just over 18 minutes, thus we also added another video around 18 minutes long that had more than 100,000 views. This left us with the 26 videos that we fully analyzed for our data set. Each video was coded individually by 1 faculty member and 4 undergraduate students. The coding results are summarized in the data table below.
Patterns
General
We noted that the majority of videos tended to address trends in first ionization, rather than multiple ionization energies. Further, high levels of causal mechanistic reasoning and science practices were noted for ionization energy. Because the trend in ionization energies was considered as a phenomenon, then all videos which had CMR also had a SP. Most interestingly, we note that the explanation for the trend across the periodic table tended to provide a much greater level of depth than for the trend down the periodic table.
Johnstone's Triangle
Similar to other topics evaluated, we found that most of the ionization energy (IE) videos we coded included symbolic representations (25/26 or 96%). Compared to other topics, IE videos were mid range though slightly above the overall average for incorporation of macroscopic and particulate representations with 62% of the videos including macroscopic representations (high: entropy, 95%; low: bonding, 18%; overall average, 53%) and 69% containing particulate representations (high: atomic radii: 82%; low: Le Charlier’s Principle: 16%; overall average, 54%).
More specifically, we noted that the periodic table was the most frequently used symbolic representation in the IE videos,with only a few incorporating chemical equations. This makes sense these videos focused on periodic trends can be easily visualized using the periodic table rather than a chemical equation. However, some videos did use chemical equations illustrating the loss of an electron to form an ion. This use of equations was most frequently the case for videos that talked about trends in successive ionization energies rather than those focused solely on trends in first ionization energies. We also noted that many of the particulate representations were not strong, but still met the criteria to count the video as having it present. For example, the most frequently particulate representation was the Bohr model of the atom, used to depict relative positions of valence and core electrons. However, these representations were often not directly connected to symbolic and/or macroscopic representations.
When comparing the JT elements to other framework elements evaluated, we found that when all JT elements were present, the videos tended to be high on the multi-media rating and more frequently incorporated core ideas. This could be due to better overall quality of videos that contained more elements. Another observation was that videos containing clear connections between JT levels tended to have more of the 3D Learning elements (CMR, Core Ideas, and Science Practices). We have found similar connections with previous topics, noting in particular the correlation between the Science Practices and macroscopic phenomena. If a video attempts to explain a macroscopic phenomena or trends in data at the particle level, this often results in the video hitting many of the criteria for JT and 3D elements.
3D Learning Elements
Core Ideas (CI) were noted in 18/26 videos (69%). The two CI identified in the videos were Atomic/Molecular Structure & Properties and Energy. A video was considered to contain the Atomic/Molecular Structure & Properties CI if it provided an explanation for relative reactivity, or explained why common ions are formed by different elements. Video with the CI of Energy either explained trends in first IEs or trends in successive IEs for individual elements with a focus on the differing strengths of attraction between the nucleus and valence electrons as a function of distance, charge of the nucleus, or charge of the ion. Energy was by far the more prevalent CI present in the analyzed videos, with 16/26 (61.5%) of the videos having sufficient explanation on the topic (labelled with an E in the summary table). Only 3/26 (11.5%) of the videos was found to include the CI Atomic/Molecular Structure & Properties, and only 1 video included both CIs (labelled with an A in the summary table). This is indicative of the fact that most videos focused exclusively on explaining the trends in IE and did not seek to connect those trends to other chemical phenomena such as relative reactivities.
Of the 26 analyzed videos, 18 included a Science Practice (SP). The three observed SP, in order of prevalence, were Constructing Explanations (38.5%), Analyzing & Interpreting Data (34.6%), and Developing & Using Models (26.9%). 15.4% (4/26) of the videos included two SP and 2/26 (7.7%) videos contained all three SP. The differences in SPs included whether the video included data, often in the form of a graph of IE trends but sometimes just raw IE numbers for elements or ions, or whether they just aimed to explain the general periodic trend of IEs increasing from left to right across a period and decreasing down a family. If videos started with the data, then they frequently included the SP of Analyzing and Interpreting Data whereas if they just focused on the trend, then the SP would be Constructing Explanations. Videos that addressed Developing & Using Models were ones that relied heavily on using visual Bohr models of atoms in developing their explanations of the trends.
Causal Mechanistic Reasoning (CMR) was present in 50% of videos. It is interesting to note that while most videos focused on trends in first IEs included both trends across a period and down a group, 10 of the 13 videos found to contain CMR level explanations only met this level for explanations of trends across a period. In most videos we found that the trend down a group was explained by saying as you go down, you add more shells of electrons and thus the IE decreases with no mention of how attraction is affected by distance or the fact that Zeff remains constant within a group, both key elements of a CMR level explanation of this trend. However, as the trend across the period is less intuitive – you are adding more electrons but the IE increases – a more thorough explanation involving key elements of Coulomb’s law (charge and distance) was more frequently given.
Another pattern that emerged was the frequent co-occurrence of CI, SP, CMR, and connections between JT elements. Of the twelve videos that contained JT connections, 61.5% met criteria for CI, SP, and CMR simultaneously, compared to the 23.1% of videos without JT connections that met all three. 38.5% of videos with JT connections contained more than one SP. It should be noted that for this topic, there was an exceptionally high correlation between SP and CMR, with all the videos containing CMR also containing SP. Most frequently for other topics where we find videos that have CMR but not SP, it is because there is no phenomena or data that the explanation of the concept is grounded in. However, for this topic we were focused on videos that aimed to explain trends in data, so any video that had CMR also by default had to address the SP of constructing explanations at a minimum.
Multimedia Patterns
The ionization energy videos showed an average incorporation of multimedia aspects in comparison to other topics, however it was above average for segmenting. Half of the videos (13/26, 50%) were rated high for their use of images, meaning that they contained images that were relevant to the concept, accurate, and were explained well for novice learners. The other 50% (13/26) of videos that were ranked poorly for this category either did not contain meaningful images or the images were not explained such that a novice learner could grasp their meaning. Two of the videos contained images that were incorrect, which landed in the low category. 17 of the 26 videos (65%) were noted as high for text. This meant that text throughout these videos was limited and did not take up large portions of the screen at once. This helps students focus on what the narrator is saying, without getting distracted by long written-out sentences. This is slightly lower than the 70% average across all topics evaluated. Though above the average across all topics of 29%, only 31% (8/26) of videos scored high on coherence. This indicates that most of the videos had notable distractors (music, flashy transitions, etc.) that drew a student’s attention away from the main point of the video. In many cases, as is also true for other topics, a number of the ionization energy videos include the instructor on screen the entire duration of the video while simultaneously presenting content, leading to a low rating. For segmenting, the ionization energy videos analyzed rated higher than the average across topics of 58%, with 62% (16/26) videos containing structural elements to support learners’ organization of content, such as being organized logically, having a clear introduction and conclusion, using headings for topics, and providing a summary.
Content Accuracy and Accessibility Patterns
As a whole, ionization energy videos had fewer inaccuracies, with only 3/26 (12%) of the videos having clear errors as compared with an average of 20% errors across other topics. Two of the videos included incorrect Bohr diagrams in their explanations, and the third video included several incorrect or incomplete statements. However, the ionization energy videos were slightly higher than the overall average (31% vs 29%) for misleading elements. The most common misleading elements in the ionization videos analyzed were more extensive personification. Examples of this would be an instructor commonly saying, “atoms won’t want to give up an electron” or “the atom wants to hold the electron tightly.” Autocaptions were frequent among videos, with 14 of the 26 having them. This means that there is no punctuation or capitalization, and scientific terms may be misspelled. This can confuse novice learners. 7 of the 26 videos (27%) also contained analogies, meaning most videos did not include this learning aspect. An analogy is a reasoning or explanatory tool that instructors use to draw a parallel between two different domains to highlight shared patterns, relationships, or functions, thereby making a concept easier to understand or analyze. When analogies were used, instructors typically aimed to explain the relationship between the nucleus and the electrons. For example, one video used dogs and their relation to bones. The instructor explained the nucleus as the dog, and how it would be more difficult to pull the bone away (the electron) the closer it was to the animal. However, it is important that the viewer understands the analogy prior to explanation, or it would not be beneficial. This explains why visual presentation is as important as verbal.